Validating CMS event display tools with real data
This is a report on the work done for a talk to CHEP09 Conference , Prag 21-27 March 2009.
Abstract
An ideal general purpose event display for HEP experiments should:
- shield completely the user from data complexity providing an user friendly GUI
- be fast enough to allow scanning of hundreds, if not thousands, of events in a few minutes
- be light enough to allow access everywhere, also from an Internet cafe'
- produce quality images and animations for publishing and press
- highlight the most relevant event features

This is indeed a complex task and what is presented here is how the
tools now available in CMS cope with this goal. For this reason they were used to access,
scan and analyze visually cosmic runs containing millions of events.
The results of these tests provide a picture of what to expect in the LHC environment
and give feedback for the improvement of these tools.
Introduction
At the beginning my idea of how to develop this validation was that I would look at some events with the event
display tools available and at the end give a kind of score card saying this tool is good for this but not for this, etc.... But how many events and which events I had to look
out of the millions taken? Then it become clear to me that the main difference between the LHC experiments and
the previous ones concerning the event display, was that we have to deal with a huge amount of events. At this
point I found the perfect use case for this validation.
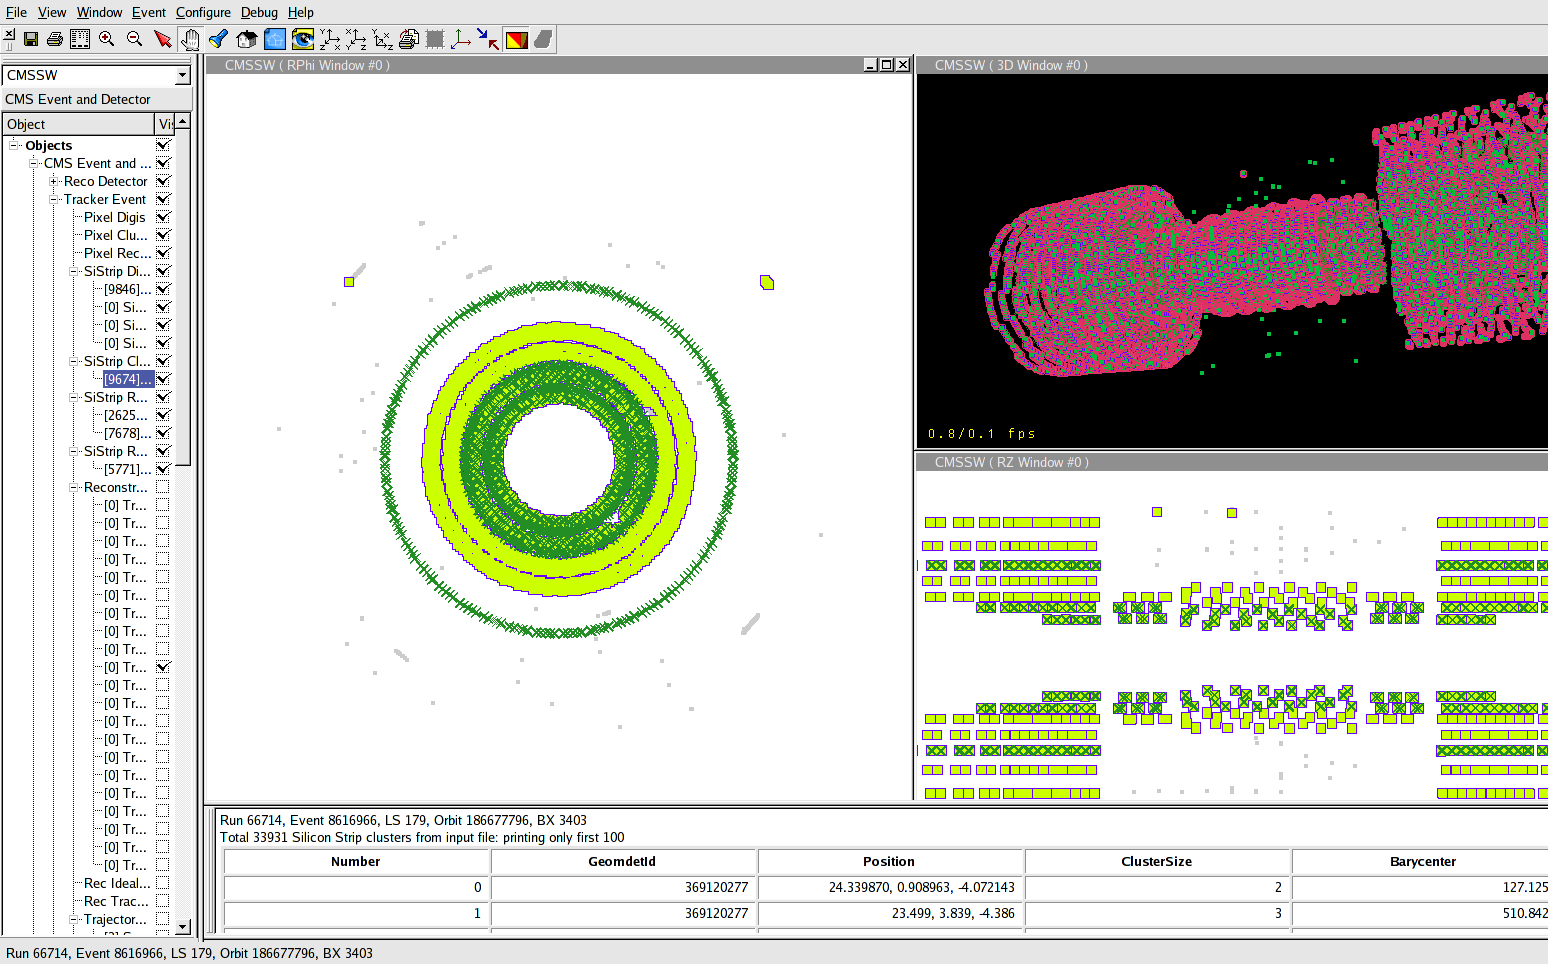
Looking at the data taken in the last cosmic runs , I found some strange events containing a peculiar pattern
in tracker endcaps: strings of clusters aligned with beam line and apparently with no connection with the
cosmic track. I found only one or two every 10,000 events. Since most of the time these aligned clusters weren't
reconstructed as tracks, you couldn't study them with usual analysis metods (i.e. without using the
event display).
At this point I would like as I said in the abstract
to "access ,scan and analyze visually cosmic runs containing millions of events" in order to have some answers
to questions like these:
- Were these events present in all runs?
- Were these events present in equal percentage during the whole run?
- Were these strings distributed uniformly in space (i.e. were all tracker modules interested or only a part of them)?
- Were these events present without magnetic field?
- Were these events present in Montecarlo samples?
To answer these questions I had to develop a system to help me select runs and events inside a run: this required around two months.
At the end this presentation has become the story of this quest to look at all events to study this pattern.
So, you wan't find here the score card you expected: the available event display tools are all fine programs but
in the brave new world of LHC
experiments , if we want to use these fine tools we have to develop a system to assist them and the main purpose
of this presentation is to say what and why we need this.
(The answer of the riddle of the aligned clusters is at the end).
The Challenge : some numbers about CRAFT
CRAFT was the last data taking period with Cosmics and the complete CMS detector. It has provided the biggest and most complete data
collection until now and is used in this study about CMS event display tools.
- Number of events with cosmics tracks : around 300M divided in around 140 good runs ; but the number of events with tracks is only 7M. So expect around 1 event with tracks every 50 events.
- Events taken in around 20 days at the rate of around 300/sec.
- Each event replicated at least 3 times in around 6 different PDS
- Many thousands of dqm plots available for each run and directly accessible from disc(afs area).These plots are filled for all events in a run.
- Average number of events for each run 2.5 M stored in around 100 files of 20,000 events each one but with some
very big runs (up to 15M) and very small (<1M). Each file is available on Cern cluster lxplus from castor mass
storage.
- You can access a single dqm plot for all runs and process them in around 1 minute (300M processed)
- You can do plots of quantities already contained in a file in 1 minute(20,000 events processed but sometime you need to load the file from castor to disk)
- Time necessary to do a simple plot on all events of a 6 M events run: 10 hours inside CMSSW with maximum storage 1500MB; 5 hour with bare Root with maximum
storage 350MB.
Three programs and a Framework
CMSSW is the framework used to process CMS events. It is a very complex softare
that stores events in Root format.
So the minimum software necessary to process CMS events is Root. But this knows only the bare CMS event layout and can represent a quantity only if this is physically
stored on disc.
Root+ FWLite will allow the user
to visualize quantities (like track pt) that can be computed with a simple method from stored quantities. FWLite is an integral part of CMSSW and it is distributed with CMSSW . It is a kind of programming user interface created to shield
the user from CMSSW complexity allowing him to analyze data with simple scripts
in CINT or python. Although it can in principle do everything that CMSSW can do,in practice (at the moment I write this) it is used only for simple interactive analyses of data.
Then you have the full framework (called CMSSW) that allows the user to access any class and any CMS environment data stored on CMS databases.
An event display completely embedded inside CMSSW has the advantage it can
use any CMSSW class and access any data contained in CMSSW databases. Unfortunately this also means an heavy use of computer and network resources that slows
down considerably the visualization degrading the user experience.
All the four event display tools I used for this test have dealt in some way with this
problem.
First of all we have the two CMS general purpose event display tools:
- Iguana will run both completely embedded in CMSSW or as a so called
"iView browser" that will display events in a special format created by
normal CMSSW tasks with no graphics. The event in the special format can
be read from a normal file or provided by a server with VisNet protocol.
- Fireworks uses FWLite and in this way
shields the user from CMSSW complexity. The use of FWLite is also done
in such a way to optimize the use of computer resources and the result is
an easier to use and faster program.
Then, there is another general purpose event display tool: this isn't supported
by CMS and is essentially the result of the efforts of a single person , Loic Quertenmont, that allowed
me to use it for this test. His tool is experiment independent and is used in many experiments.
Frog
works only outside CMSSW. It is based on a custom event format
completely independent from CMS (it can be used to display any hep experimental data). In this way it can be used on many platforms (Windows,Linux,Mac).
The CMS specific part is a normal CMSSW task that will access CMS events
and store them in the frog format. The data stored contains not only geometric
data but also any other kind of data that can be used later in the visualizer
either to be displayed as it is (when picking the object: i.e. track pt) or
to apply cuts.
The last tool used is the trackermap. A visualization tool specialized for tracker. This is a synoptic
view of the tracker and is implemented both in "Iguana embedded" and as single class that uses no other
CMSSW services and allow its use like a Root histogram.
Because of the use case I was validating what mattered for me more in a tool was speed and the possibility
to access 3D view (I had to check tracks in space).
A test of speed done scanning visually 551 events (same machine, local access to events) gave me the following
result:
| fireworks | 2' |
| iguana embedded | 8':30 sec |
| iguana iView browser | 30 sec |
|
frog | 30 sec |
These results and the fact that fireworks at the time I started the study didn't have 3D view and iguana iView was
not yet available , forced me to
use frog . I used also extensively the trackermap outside iguana.
Note: at this point people that were expecting a score card will become extremely disappointed about how I am proceeding. I have discarded from the validation
the two CMS ufficial programs because they are not ready. Unfortunately this
is the truth. Try to look with Iguana or Fireworks at a 20,000 events sample
as I did with frog: it is impossible unless you want to spend days on it.
And the reason for this isn't because iguana or foreworks are slow as display
program but because they are embedded in CMSSW. In fact iguana outside CMSSW
is as fast as frog! So ,at this time, I had two possibilities: use frog or wait
until iguana outside CMSSW was ready.I choose of course the first approach since
my experience would benefit the iguana and fireworks developers. Also CMSSW
developers could try , from my experience, if CMSSW could be optimized for
this use case.
What means looking at events in an experiment like CMS
Although the use of event display for monitoring or other applications was quite obvious in old
experiments, with Cms and similar new generation experiments, its use should
be rethinked. We take so many events and most of them are garbage that looking
at them to help in monitoring or other tasks , may seem like the proverbial
searching for a needle in a haystack. Looking at a few random events isn't
a big help. It will easily let you miss the few interesting events.
So, if we still want to use an event display to look at ALL events in a run, the only solution is
to select the possibly interesting events and look only at them. Taking in
account that we would like to look at all events and that a person , even with a
a fast program, cannot scan more than a few hundreds events in an hour , than
an optimum cut should take only around 1 event every 100 events in a run.
For example , for tracker monitoring, we could request only events with
number of tracks > 0. If the filter is fast, this will allow us to scan one million
events , in a few hours.
The user should also be able to change easily his/her selection
strategy , based on the features of selected events.
For example scanning the sample with tracks he could find some events with
a very big number of clusters and he wants to know if there are events with
large number of clusters but NO TRACKS.
Another important thing is that the user should be able easily to change
from run to run without bothering with list of filenames.
Since you have so many events that you cannot even in principle look, it would be nice to have access to synoptic views that would show in a single image the main features of a run. This image should be created processing all events and used to give the user a rough idea of what's happening in the run. By putting toghether all 150 miniatures of these images(one for each run), you have a kind of visual summary of your data.
All these new requirements aren't met by the event display programs and
require the use and sometime the development of new tools.
Trying to use event display to monitor CMS tracker : my experience
The first thing was to look AT ALL EVENTS in a file (around 20,000 events).
This may seem trivial but if you look at the times reported before you see
that iguana embedded cannot be used for this purpose (too slow).
iguana light wasn't yet available. Fireworks wasn't a good tool for this purpose
since it had still no 3D display when I started this exercise: impossible to look at tracks in space. This left only frog
available. Creating file in frog format for 20,000 events requires only an hour and then in
the same time you can scan quickly all events.
The result of this scan was that the events with tracks in tracker are very
few (around 500 out of 20000) and that there were around 10 events with some
very obvious noise.
A quick scan of other runs was made possible in frog by an automatic procedure
set up by Nikita Beliy and showed that this happened in all files examined.
At this point a more thorough study was necessary. First of all I tried to
classify the noisy events. There were two obvious noise patterns.
- Events with a very big number of clusters positioned randomly in one or more of the 4 tracker parts named TIB/TOB/TID/TEC. Those events had no tracks only because the track finding algorithm will protect itself in this cases by doing nothing.
- Events with a peculiar pattern of clusters mostly in TEC. Clusters seem to be organized
in a "string" parallel to beam line. Although the modules in different layers
are aligned, the clusters aren't. But the track finding algorithms manages
sometime to fit one or more tracks completely included in TEC.
The first noise pattern has already been studied in detail by other people
and a cause has been found (it depends on trigger) so no further study was
necessary. The second type of noise was new and required now some more exhaustive visual study of events to try to characterize it. First of all it was necessary to study it during the whole run and from run to run.
We found the following possible strategy in three steps to do this and make some progress:
- Using a synoptic view of the tracker (trackermap) do a kind of tracker
x-ray showing for each module the total number of rechits during the run. This would
be done for ALL EVENTS IN A RUN , for ALL RUNS and also for MC data. Comparison of these images would clarify
if some anomaly was apparent in TEC and how this anomaly changed in time.
- When this kind of visual summary of all CRAFT data is created, classify also ALL EVENTS creating small ad-hoc Root
trees for each run. For each event a "classification ntuple" is stored containing around 10 quantities necessary to characterize the event (for example: number of clusters, number of tracks). This information will be used for further fast study of the problem and as basis for the third strategy step.(What I did here is to create so called "tags". Neverthless
I wouldn't use this name since it refers to a global strategy to access data.)
- Select a relatively small subsamble of events presenting anomalies. These subsamples should contain MOSTLY
noise events that we could inspect visually one by one.
The implementation of this strategy required around a month mostly to learn new "tricks" necessary to process so large amount of data and then another month to do
the analysis. It is incredible how difficult it is to scale from the single file analysis to the single run
analysis (which contains up to 1,000 files).Considering that the single file analysis requires less
than a minute with Root using an interpreted program, one would naively think that scaling to 1 hundred
files using a compiled program will require less than an hour.
Unfortunately also here the complexity of CMSSW will transform this simple task
in a gargantuan task requiring a ridiculous amount of resources.
It is clear that here some optimization is needed if we would like to debug
quickly the detector when we start taking real data.If you need at least a day
to obtain some simple histogram on a complete run, you react very slowly to new problems.
Implementing the strategy
The result of step 1 can be seen in this visual summary of CRAFT data.
The first row represents the rechit trackermaps for MC data samples with number of tracks increasing from
16K to 800K. Each run image should be compared with the MC image with number of tracks nearest to number of tracks
in the run. To represent number of events with rechits in a given module a "rainbow" palette is used with
blue indicating 1 event and red 255 or more events. This palette and other informations about the trackermap are
represented in the first image : the legend.
The creation of the image for each run is done by a CMSSW task that requires around 1 day . It processes
all events filling the trakermap. In the same time it stores a small amount of information for each event in
a root tree. Although it is in principle possible to run in parallel all tasks one for each run: in practice
the scarce disc resources available to a normal user on AFS wan't allow me to run more than a few runs in parallel.
The complete processing of all runs that could in principle be carried out in a week, required for this reason
around one month.
Interestingly enough, the building of this summary would allow the discovery of new problems
in tracker :for example the two blue wedges that you see in two of the discs in the bottom layer were discovered tracing their origin to a wrong cabling. The same visualization showed also clearly when problems had
appeared and when they stopped: for example you can see clearly that the hole present in all rectangular layers disappears starting from this run. It also gave a quick feedback in cases when the
problem could be solved by reprocessing the data.
It would help a lot if this procedure could be completely integrated in normal tracker data DQM processing.
Both the trackermap and the "event classification tree" could be added as additional material to the thousands
of plots already automatically available.
Once the "classification ntuple" is available, selecting the interesting events from the castor dataset can
be performed automatically by running a root macro that will process the "classification tree" , create a list
of events and then run the CMSSW task that creates the file in frog format reading only the selected events.
This operation is relatively fast (compared to full run processing in CMSSW) and can be performed on a typical
run in only an hour.
The results
Comparison of resources used to answer a query �events having aligned strings of clusters in endcaps� in run 66714
with 5,9 Mevents and 197 files.
209 events selected in the whole run. We use three methods:
- Full CMSSW :build a skim of the events presenting this pattern and then look at them. Because of the amount of resources needed, this can be run only in batch using LSF service.
- Root +FWLite without the classification ntuples. This can be run interactively on lxplus.
- We create the selection using the classification ntuples. Then we
use this list of events to look directly at events (or produce a skim).
This second step requires a CMSSW task but uses very little cpu time
and so can be run interactively on lxplus.
| 1 � Skim with full CMSSW | 2 � Selection with FWLite | 3 � Use of selection ntuples
|
| Runs | In batch on LSF | Interactively on lxplus | Interactively on lxplus
|
| CPU time | 14,881 sec | 3,546 sec | 860 sec
|
| Memory max/swap | 1286/1599 MB | 250/360MB | 1200/1400MB
|
| Solar time | 10 hours | 4 hours | 1 hour
|
| Can look at first event | After minutes or hours (depends on time the job waits before starting) | After 10 min | After 1 min
|
| Time to look at all 200 events | 10 hours+ time the job waites in queue before
starting | 4 hours | 1 hour
|
Method 2 and 3 are so fast because
they use 3 jobs that run on three different computers in parallel. The 3 jobs are optimized in order to use less resources and to be run interactively. Each job is also specialized for a task.
- The Selector: this job is specialized for selecting events. This can be done using directly the events (method 2) or using the event classification (method 3). In this case doing interactively a list of all events in a run with an arbitrary cut (i.e. tracks in TID and in pixel) takes less than 1 minute. Otherwise using FWLite it needs 4 hours.
- The Analyzer. A CMSSW task creating the file in the format requested by the visualizer for the selected events extracts quickly from events the information needed by the Visualizer. As soon as a new event is ready it is made available to the Visualizer. This job in method 2 works in parallel with 1 and so it takes no time.
- The Visualizer. After a few minutes let me look at the first selected events. In an hour I can look at all selected events in a 6M events run with method 3(4 hours with method 2) . This job can run on any computer with an Internet connection.
In any moment I can stop the process and try with a new selection
Note that both The Selector and The Analyzer could be implemented as centralized services available to
the CMS community through the Web if the CMS management decides to do so. This would clearly profit the CMS
community making the task of displaying any selection of events incredibly easy in comparison to what we have now.
The Selector would be a central service to select events with arbitrary queries returning the list of events
satisfying the query. The Analyzer would instead digest these selections returning the events in a format ready
to be seen by the Visualizer. Note that the attempt done now for an "Event Server" returning the complete events
aren't good for event display for obvious reason : the complete event needs all CMSSW software to be visualized
(instead of the Visualizer that can be downloaded and used even in a Internet cafe') and also needs a fast
link because of the size of data to be sent.
Conclusion
During data taking in CRAFT , event display use for tracker monitoring was almost absent. This was something completely
new compared to old hep experiments. The reason for this could be traced to the big number of events taken,
to the fact that it was difficult to select from all these events the interesting ones, and last but not least
to the slowness of available event display tools. I present here a possible strategy that could overcome
these difficulties and allow in principle to look at all interesting events . I have considered the practical case
that the interesting events are noise events in the tracker. A first step will create a visual summary of each run
and a classification
of the events based on their most relevant feature. This classification is an event database stored as
a simple root tree . This database is then harvested to create quickly subsamples of interesting events in a format
that can be scanned fast. This strategy was successfully tested using frog , one of the three event display tools
available. But in future it should be possible to use also iguana with its light version . After I started this study fireworks has added 3D display and it is
possible that we could somehow adapt this strategy also for use with it.
The proposed strategy requires an huge amount of resources . Its use by a
normal user is impractical and
for this reason I propose here to include it in normal DQM monitoring adding to the thousands of plots already
built for each run the following new items:
-
synoptic views of subdetectors
- a "database" of all events with a few informations necessary to classify them.
The synoptic view will show to the user which runs are to be visualized. The database will make then possible a fast creation of subsamples of interesting events in a format ready for fast scanning.
The answer of the riddle
Once the system was working it was easy to solve the riddle of these aligned
strings of clusters in tracker endcaps:
- Processing a run without magnetic field showed that this pattern is absent
- Processing a run with MC generated data showed that the pattern was present
although in a slightly smaller percentage of events.
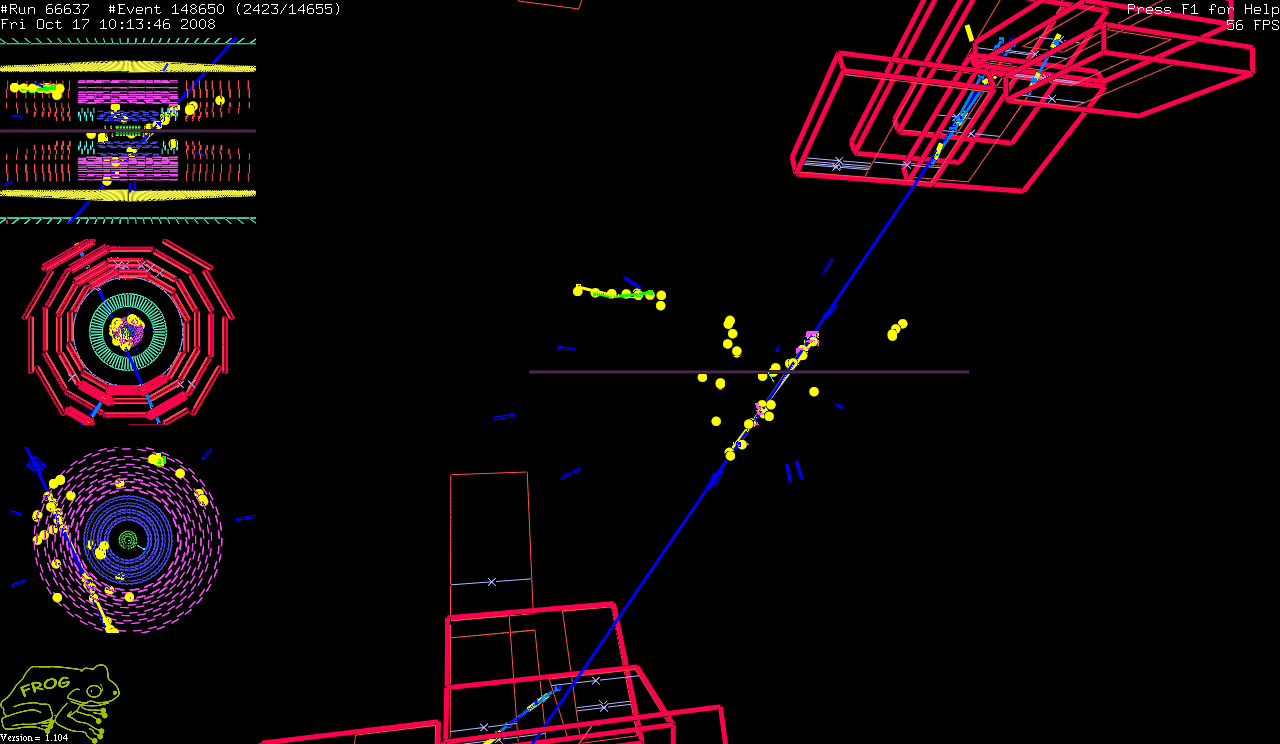
- Processing 3 complete runs I could look at a sample of 1000 events containing
this pattern. It was clear that, in almost all cases ,when the primary cosmic was
present in tracker, you could find that the line along the string of clusters
was connected in 3D to the cosmic track. Sometimes ,like in this event
, you could see the complete track originating from the primary
track.
- So these strings of aligned clusters are secondary tracks generated by
interaction of the primary track with detector materials. These low
momentum tracks spiral along the magnetic field generating the pattern
- A plot of the cluster charge confirmed this explanation.
See this post to commissioning hypernews
References
Giuseppe Zito:
info@zitogiuseppe.com
Last modified .